The Ember Inspector extends browsers' developer tools to make understanding and debugging your Ember.js applications easier.
Steps to install the inspector for Google Chrome, Firefox, other browsers (Bookmarklet), and apps running on mobile devices are explained below.
Google Chrome
You can install the Ember Inspector on Google Chrome as a new developer tool panel.
Visit the extension page on the Chrome Web Store.
Click on "Add To Chrome":

Once installed, go to an Ember.js application, open the developer tools,
and click on the Ember tab next to the rest of the devtools panels.

File:// protocol
If you need to use the inspector with the file:// protocol.
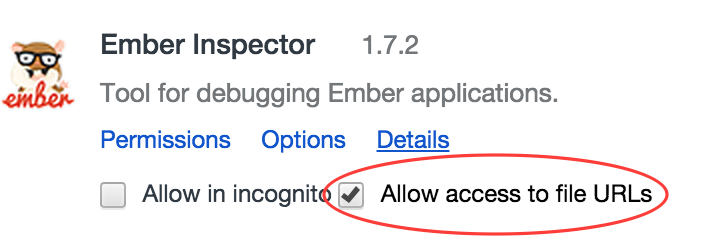
Visit the URL: chrome://extensions and check the "Allow access to file URLs" checkbox:

Enable Tomster
You can configure a tomster icon to show up in Chrome's url bar whenever you are visiting a site that uses Ember.js.
Visit chrome://extensions.
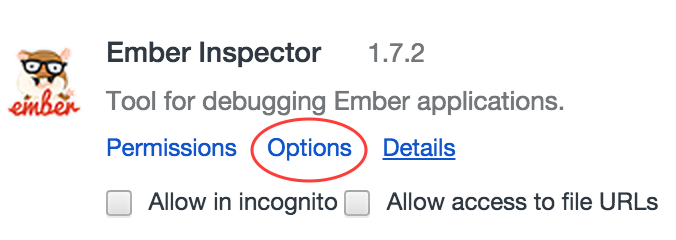
Click on Options.

Make sure the "Display the Tomster" checkbox is checked.

Firefox
Visit the addon page on the Mozilla Addons site.
Click on "Add to Firefox".

Once installed, go to an Ember.js application, open the developer tools,
and click on the Ember tab.

Enable Tomster
To enable the tomster to show up in the url bar whenever you are
visiting a site that uses Ember.js Ember.js visit about:addons.
Click on Extensions -> Preferences.

Make sure the "Display the Tomster icon when a site runs Ember.js" checkbox is checked.

Bookmarklet
If you are using any browser other than Chrome or Firefox, you can use the bookmarklet option to use the inspector.
Add the following bookmark:
To open the inspector, just click on the bookmark.
Internet Explorer will open an iframe instead of a popup due to the lack of support for cross-origin messaging.
Safari blocks popups by default, so you'll need to enable popups before using this option.
Mobile Development
If you want to run the inspector with apps running on mobile devices, you can use the Ember Cli Remote Inspector addon.