home
  • Blog
3.27
  • Introduction
  • Getting Started
  • Tutorial
  • Core Concepts
  • Components
  • Routing
  • Services
  • Ember Data
  • In-Depth Topics
  • Application Development
  • Application Concerns
  • Accessibility
  • Configuration
  • Testing
  • Addons and Dependencies
  • Developer Tools
  • Ember Inspector
    • Introduction
    • Installing the Inspector
    • Object Inspector
    • The Component Tree
    • Inspecting Routes
    • Data Tab
    • Tackling Deprecations
    • Library Info
    • Debugging Promises
    • Inspecting Objects via the Container
    • Rendering Performance
    • Troubleshooting
  • Code Editors
  • Additional Resources
  • Upgrading
  • Contributing to Ember.js
  • Glossary
Old Guides - You are viewing the guides for Ember v3.27.0.
Go to v5.0.0

Rendering Performance

Edit pencil

You can use the Inspector to measure your app's render times. Click on Render Performance to start inspecting render times.
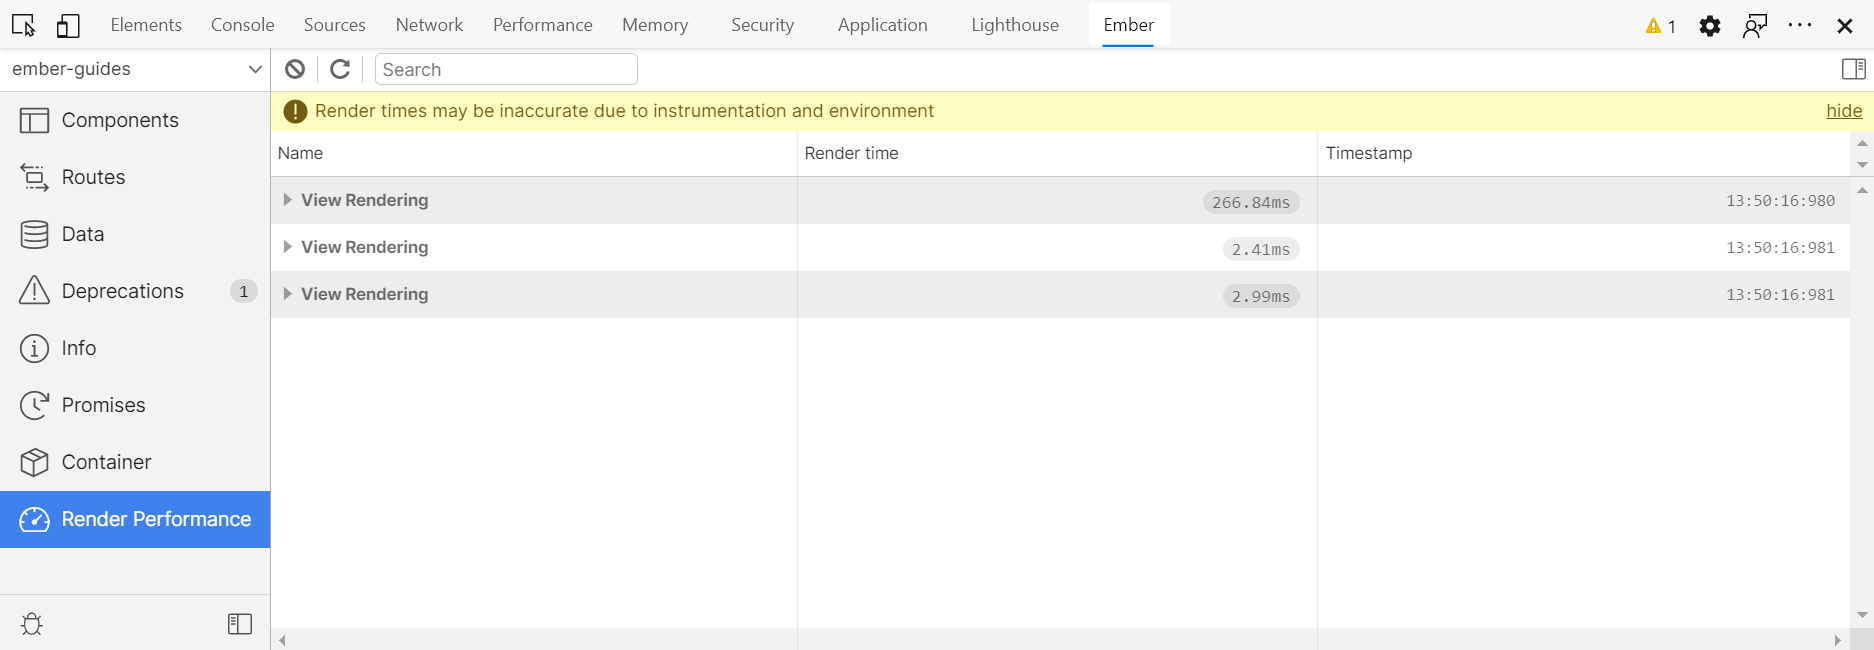
Accuracy

Using the Inspector adds a delay to your rendering, so the durations you see are not an accurate representation of the speed of your production apps. Use these times to compare durations and debug rendering bottlenecks, but not as a way to accurately measure rendering times.

Toolbar

Click on the "clear" icon to remove existing render logs.

To measure components and templates that are rendered on initial application boot, click on the "Reload" button at the top. This button ensures that the Inspector starts measuring render times when your app boots.

To filter the logs, type a query in the search box.

left arrow
Inspecting Objects via the Container
Troubleshooting
right arrow
On this page

  • Accuracy
  • Toolbar
Team Sponsors Security Legal Branding Community Guidelines
Twitter GitHub Discord Mastodon

If you want help you can contact us by email, open an issue, or get realtime help by joining the Ember Discord.

© Copyright 2023 - Tilde Inc.
Ember.js is free, open source and always will be.


Ember is generously supported by
blue