You can inspect the current views and components rendered in your application. The View Tree shows you a tree of what is currently rendered, along with templates, controllers, and models backing each view.
Click on the View Tree menu on the left to see your views.

Inspecting Objects
You can click on any model, controller, view, or component to send them to the object inspector.

You can also click on the $E button next to them to send them to the console and
assign them to the global $E variable.
Inspecting Templates
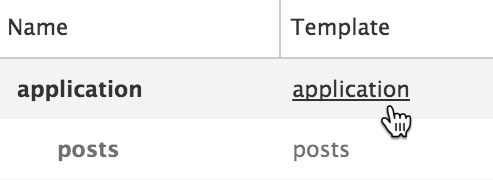
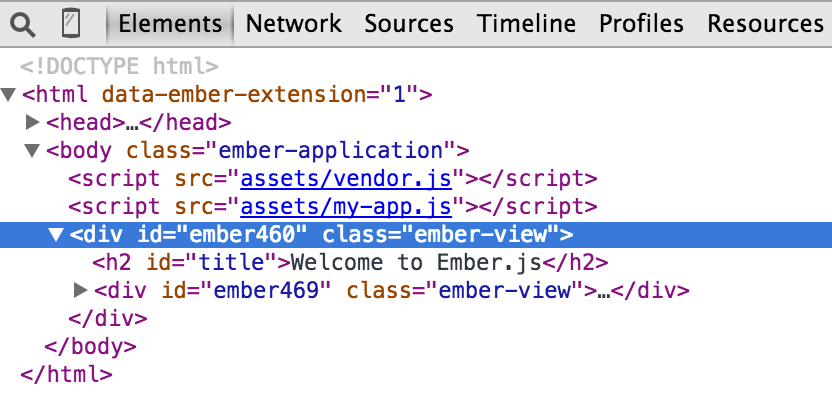
If you are using Chrome or Firefox and click on a template that has a DOM element, you will be sent to the Elements panel with that DOM element selected.
Components and Inline Views
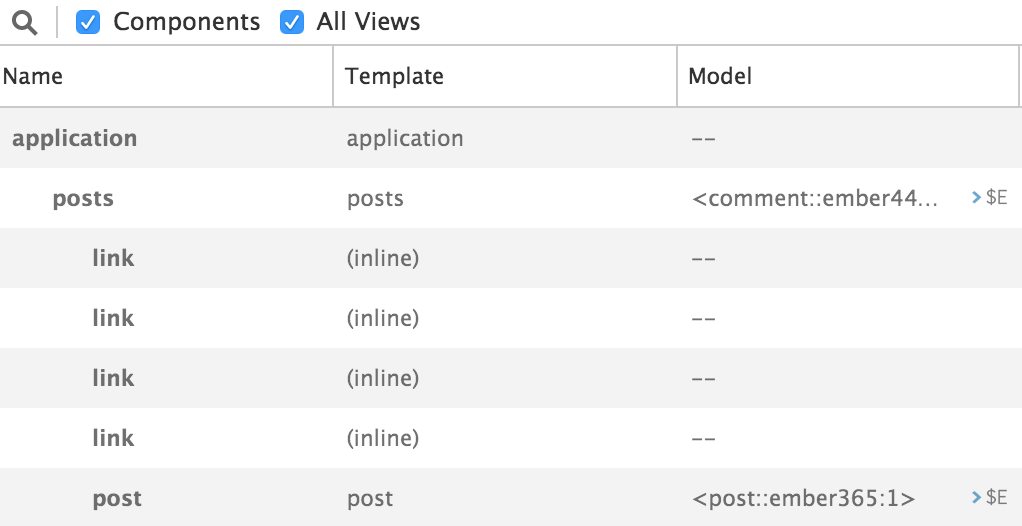
The View Tree ignores components and inline views by default. To
see them, check the Components and All Views checkboxes.
Highlighting Templates
Hovering over the view tree
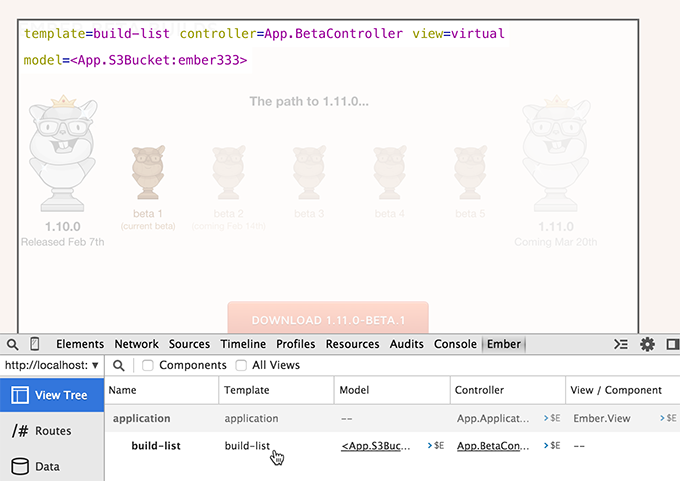
When you hover over the views in the list, the templates will be highlighted in your app. For every highlighted view, you can see the template name, controller, view, and model.
Hovering over the app
If you want to highlight a template directly from your app, you can click on the magnifying glass and hover your mouse over your app. Any time your mouse passes over a template, that template will be highlighted and will show its name and its model, controller, and view names.
If you want components to be highlighted, you will need to check the
Components checkbox first.

If you click on a highlighted template, you will select it and can then click on the controller, view, component, or model to send them to the object inspector.
Click on the X button to unselect a template.
Render Duration
Duration displays the time it took for a specific DOM element to be created along with all its children.

Instrumentation however adds its own delay to rendering, so the numbers you see are not an exact representation of production apps. These numbers should be used to compare rendering times, and not as a replacement for performance benchmarking.